Thread Starter
#1
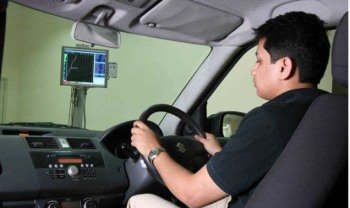
Fuel efficiency figures measured in the Indian Driving Cycle (IDC) may have the accuracy and consistency of a laboratory. But can they be relied on? It's a little bit like a video game — the objective being simply to follow the graph so that you continue at the correct speeds for the test. There's a screen in front of you and you have to accelerate, change gears, brake and stop in a way that keeps the moving cursor on the straight and narrow, or a graph that plots speed versus time. There's very little room for deviation. Accelerate too hard, or brake too late and the cursor slips out of the tolerance zone and you have to start the process from scratch. It's not as easy as it looks. With no road movement, you tend to accelerate faster than you should but the key to success is to anticipate the gear changing and the braking points While it is fun to drive like this, it is far more serious than any video game, this is a test — one that can make or break any new model that's entering the Indian market.
This is the Indian Driving Cycle (IDC), a laboratory test on a rolling road which simulates a typical Indian driving environment over 10 km. Every car in India is measured for exhaust emissions with this system and either passes or fails.
IDC test
A day in Maruti's state-of-the-art emission testing laboratory in Gurgaon gave an idea of what goes into a typical IDC test. However, for the official exam, in-house testing won't do and the car has to be taken to an officially approved centre (ARAI, VRDE or iCAT) where only their officials may drive the cars.
At the heart of this test is a chassis dynamometer with a rolling road on which a car is ‘driven.' But in order to simulate vehicle inertia and all the forces acting on a chassis dynamometer and to make it seem like the vehicle is running on a normal road, a lot of data needs to be fed into the computers to ‘load' the rolling road correctly.
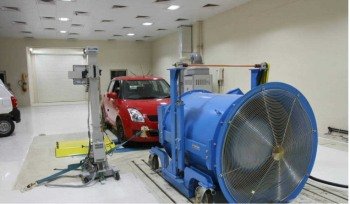
Air drag and mechanical friction (essentially the rolling resistance of the tyres) must be measured. This is done by taking the ‘coast down' or roll to a stop measurements on a normal road. The inertia of a vehicle, which is a function of kerb weight plus 150kg (two-passenger load) is also factored in. Each model has its own values and has to be tested individually. To simulate air flow to the radiator, a large fan in front of the car goes faster with a corresponding rise in road speed. The lab temperature is kept at around 25degree Celsius but a variation of plus or minus 5 degree is allowed. As if all of this wasn't painstaking enough, the vehicle has to be ‘soaked' in this environment for a full eight hours.
Once this process has been completed, you're ready to go. Except the car isn't in fact going anywhere. After the car has been firmly strapped into position, the non-driven wheels tied down and each driven wheel carefully placed on a pair of rollers, a huge tube is attached to the tailpipe to funnel the exhaust gases into what look like very large plastic bags. They are in fact high-tech monitoring devices which measure every good, bad and ugly molecule of exhaust emissions that's been collected after running the car over the 10km IDC.
The report card then tells you which cars are dirtier, and which cars are cleaner. But the public never gets to know such details; it is just a simple pass or fail test. And to be legal on Indian roads, all cars simply have to achieve a pass.
Luckily, it's a different story with fuel efficiency. In January, the Society of Indian Automobile Manufacturers (SIAM) decided to publish industry approved figures for fuel economy and lay bare the cars that are thirsty, and the cars that are thrifty.
But how is fuel efficiency calculated? It isn't done with a fuel flow meter or in fact, by measuring fuel at all. The very same exhaust gases that are analysed for the emissions test are measured for fuel consumption as well. Once the breakdown of the exhaust gases is available, an empirical formula is applied to arrive at the fuel efficiency. We are told this is the most accurate way of measuring fuel consumption and that this methodology is the global standard. But are these figures for real?
The right figure
To understand how the industry has arrived at these highly exaggerated figures, you need to do study the IDC.
The entire cycle lasts 1,140 seconds and covers 10 kilometres which translates to an average speed of 31.6kph. The gentle driving technique that can be adopted and a fair amount of relaxed cruising in top gear, which is never over 90kph, seriously help efficiency. Having an extra ratio is also beneficial and a reason why six-speed gearboxes are becoming more and more common. It's primarily to bring down emissions (and fuel consumption). Fuel consumption is much worse in the real world than on the IDC. The chaotic nature of our urban zones with the constant stopping and starting, the long periods of idling and heavier use of the throttle pedal (to zoom past that amber light) is far more brutal on economy than the sealed-off environment of a lab. If anything, the IDC figures allow for easy repeatability and consistency thanks to the highly controlled test environment, which is impossible to achieve in the real world. This has allowed the IDC to create a good reference point in the relative comparison of cars. But even this has its flaws. Air-conditioning, which is standard in over 90 per cent of our cars, is not considered and can be misleading because the impact of air-con on a small car is much more than on a bigger car. Also, figures from the IDC may vary depending on which government approved testing centre is used — ARAI (Pune), VRDE (Ahmednagar) and iCAT (Manesar).
The IDC figures are now being used by car companies in their advertising campaigns to woo consumers with unheard of fuel economy. Some cars have shown huge improvements in fuel economy after the shift from BS III to BS IV which, rivals claim, could only have been achieved with a ‘champion' car, in other words, a car that has been tweaked purely for the test.
Source:Hindu
Attachments
-
22.5 KB Views: 365
-
24 KB Views: 374


![Smile [:)] [:)]](https://www.theautomotiveindia.com/forums/images/smilies/Smile.gif)